Creating a Sustainable Professional Network of K-16 Science Faculty


All program areas showed large increases both in the numbers of collaborations among participants, and in the numbers of "vertical" partnerships - those that were between a K-12 teacher and an IHE science faculty member. The numbers of collaborations within each area before and since the VIP project are shown in Table 1.
Table 1. Increases in the numbers of collaborative relationships among VIP participants and in "vertical" collaborations between K-12 and IHE faculty, in four program areas.
|
Area of collaboration |
Number of collaborations |
Change |
Number of "vertical" collaborations |
Change |
||
|
Before VIP (2002) |
Spring 2006 |
|||||
|
Before VIP (2002) |
Spring 2006 |
|||||
|
Inquiry instruction |
194 |
711 |
4x |
19 |
181 |
10x |
|
Mentoring relationships |
25 |
175 |
7x |
7 |
69 |
10x |
|
Undergraduate teaching interest |
42 |
154 |
4x |
5 |
49 |
10x |
|
Planning VIP activities |
85 |
623 |
7x |
26 |
195 |
8x |
The graphical networking diagrams display very dramatic changes in all program areas. As an example, the diagrams for program area 1 (sharing inquiry teaching strategies) are shown in Figure 1 (the overall network) and Figure 2 ("vertical" collaborations).
Fig. 1. Networks on sharing new inquiry science teaching strategies or materials: before and since VIP.
|
|
|
|
Before VIP (2002) |
Spring 2006 |
|
N=134 (Network participants= 110; Isolates = 24)
|
N = 134 (Network participants= 134; Isolates = 0)
|
|
NOTE: Detail may not sum to totals because of rounding. SOURCE: Survey on Collaborative Ties Within the Vertically Integrated Partnership (VIP) Program, 2006. |
|
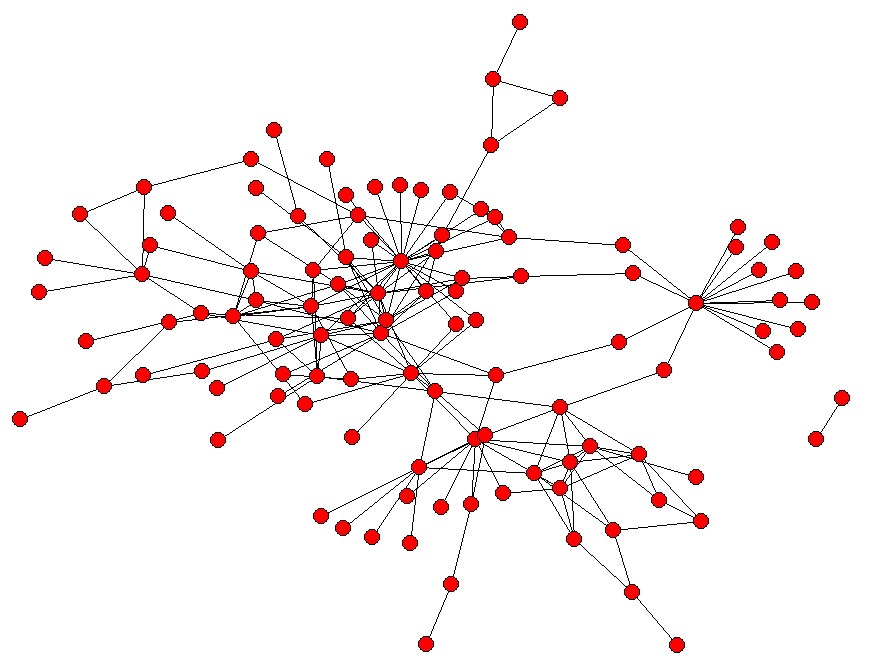
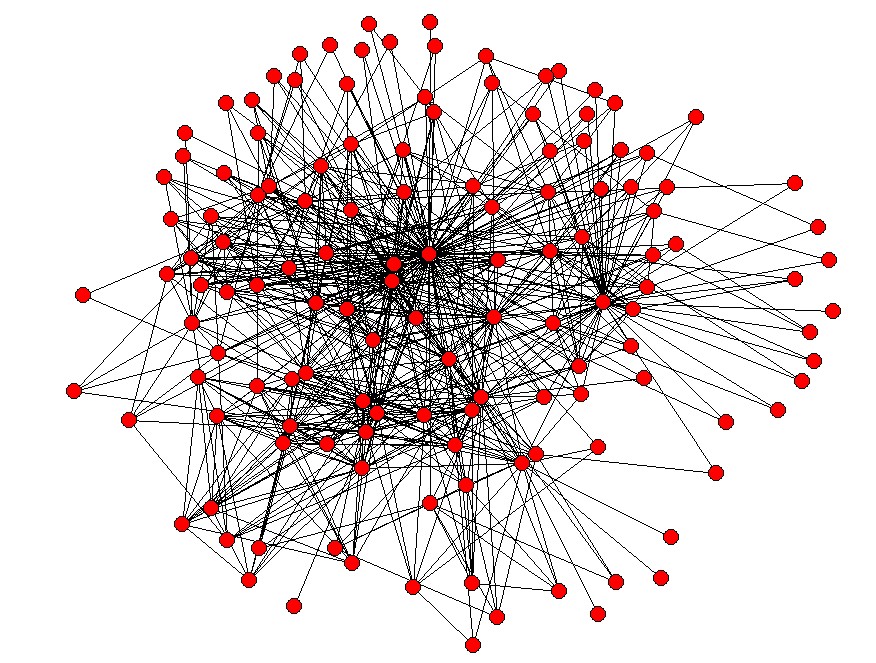
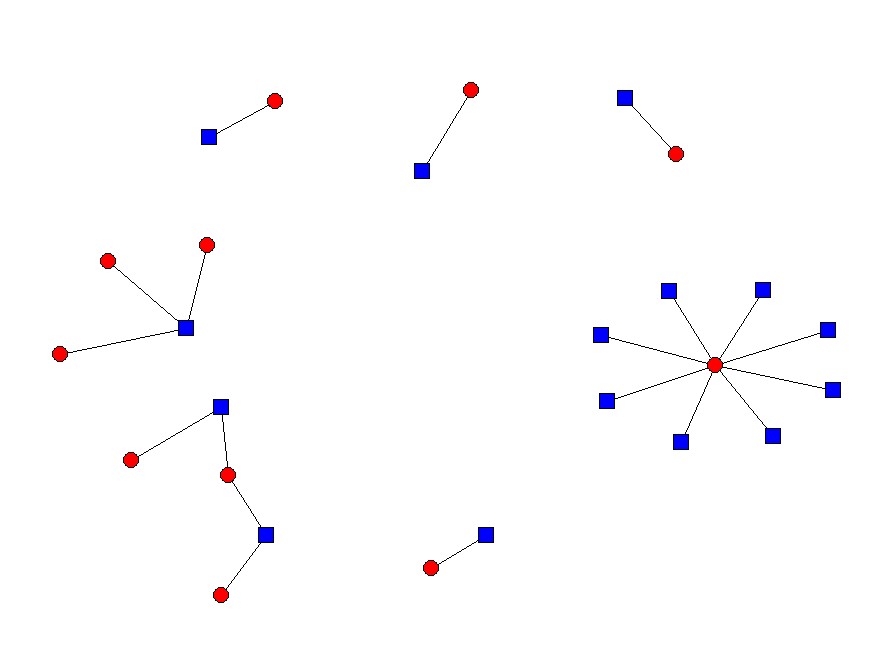
Fig. 2. "Vertical" networks on sharing new inquiry science teaching strategies or materials: before and since VIP.
|
|
|
|
Before VIP (2002) |
Spring 2006 |
|
N=134 (57 IHEs and 77 MCPS)
|
N=134. (57 IHEs and 77 MCPS)
|

|
|
|
NOTE: Detail may not sum to totals because of rounding. The networks focus only on ties between IHE and K-12 participants and they do not include ties within each of the two groups. SOURCE: Survey on Collaborative Ties Within the Vertically Integrated Partnership (VIP) Program, 2006. |
|
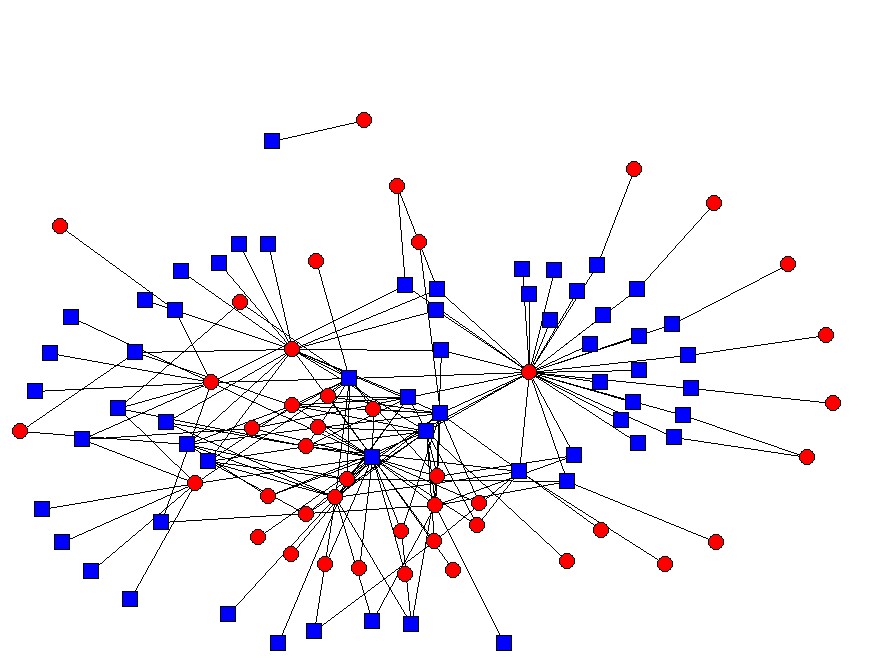
In addition, the data show that a few key personnel are central to the networks and have connections with relatively many other participants. However, removing these people from the analysis in most cases does not disrupt the high density of the networks. In other words, while these key people are connected to a large number of others, the others are still connected to each other directly and not just through key leaders.
Again, these results indicate a large increase in the number of collaborations but not their intensity, something upon which the interview responses touched. The comments of those participants who were interviewed revealed the following themes:
Minimal connections meant either minimal involvement, or intense collaboration with a few partners;
Teachers and faculty liked the benefits to their teaching and curriculum, as well as the more collaborative work atmosphere engendered by the new connections.
Challenges to continued partnership included time and geographical constraints; administrative resistance; and human fatigue.
Sustainability of professional collaborations requires formal structures, which in turn require dedicated funding.
