Using Social Network Analysis to Understand Links Between Teacher Leader Roles and Student Achievement


Social Network Analysis was conducted in 29 schools over a three year period from Spring 2006 to Spring 2008. For each school, math teachers, learning team members, and other administrators were asked to complete a simple survey. The survey asked them to name individuals they communicate with and collaborate with about mathematics education. Survey respondents could name as many people as they wanted-some listed just a few while others listed twenty or more individuals. In addition, they could list people who worked both inside and outside their school. This approach can be referred to as an 'open' model for conducting social network analysis (Hanssen, 2009).
Completed surveys were used to create a data file that could be read by the social network analysis software package. For our project, we used UCINET software. The data file contains two columns-the first column indicates the 'chooser' or person who completed the survey; the second column indicates the person named. Each chooser and person named was assigned a unique ID. For all schools, the number of individuals named exceeded the number of people completing the survey. A separate data table was also created that contained available demographic information. Both of these files were then read into the software package for analysis.
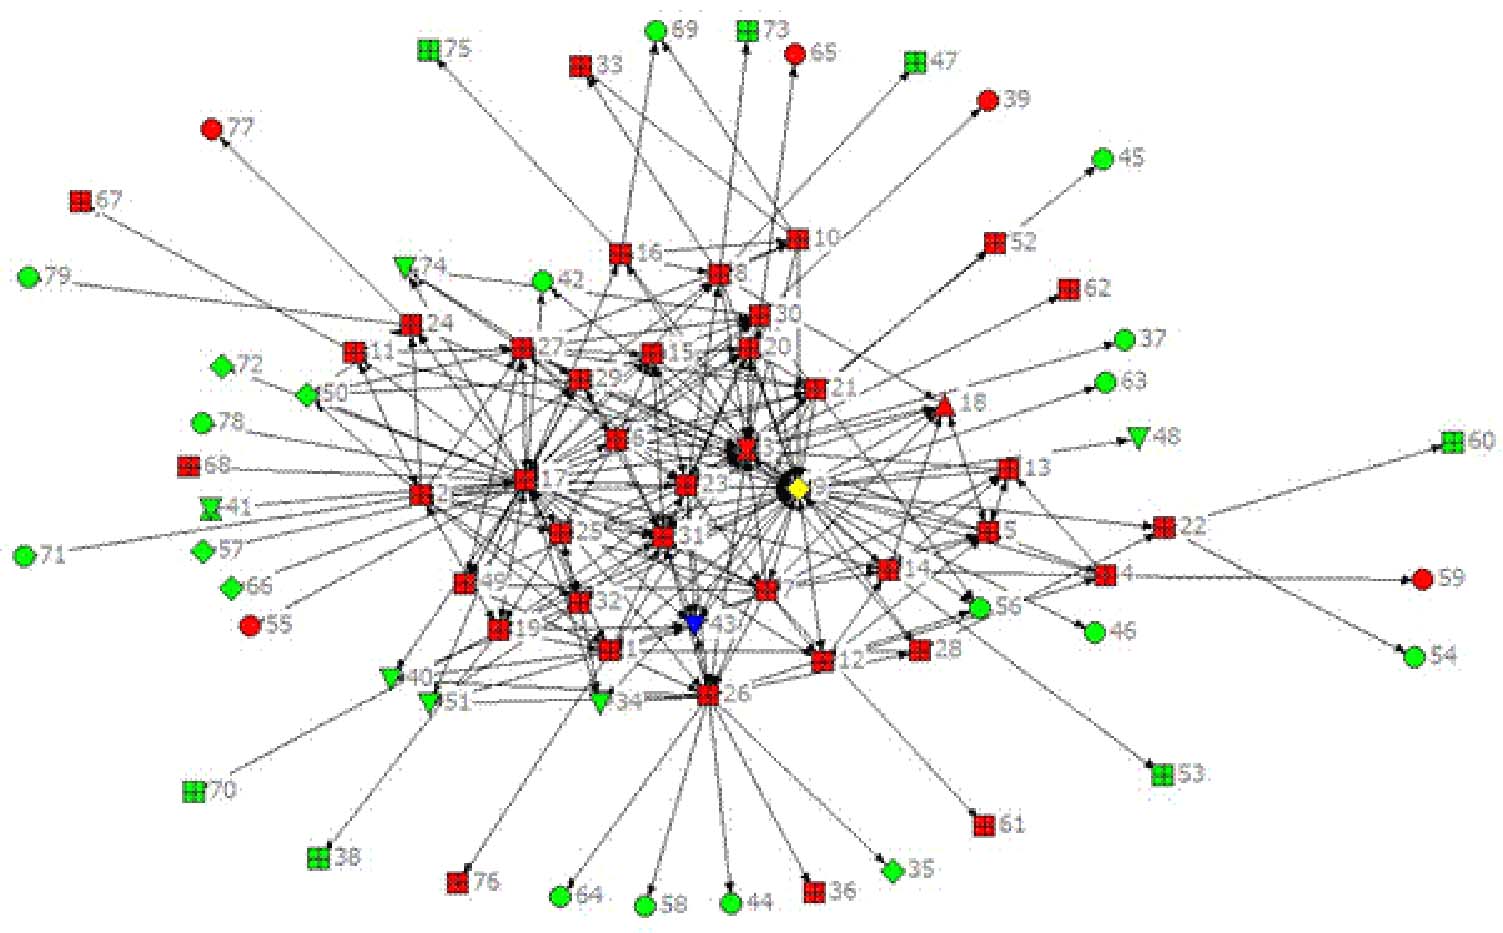
The first analysis step was to create a sociogram-see Figure 1 below. A sociogram graphically depicts the communication network inside of and outside of the school. Within the sociograms, individuals playing key roles were identified. For example, the school Math Teacher Leader (MTL) was identified as a yellow diamond. The Math Teaching Specialist (MTS) assigned to that school was identified as a blue triangle. Other roles received similarly unique colors and shapes.
Descriptive statistics were also obtained. First, network density was calculated. This is a measure of network strength. Network strength was operationalized as the proportion of all possible communication ties that were reported. For example, in a network of three individuals, there are six possible connections that can be achieved only if each person in the network names every other person in the network. This would produce a network density measure of 100%. Obviously, this level of density is rarely achieved because not all parties will indicate that they have a connection with all other possible parties.
Second, the importance of key roles within the network was determined by calculating the In-Degree measure. Specifically, we were most interested in the In-Degree measures for the MTL and the assigned MTS as indicators of how important these individuals were viewed by others in their network. Some regard the In-Degree statistic as a measure of 'popularity,' but we feel it is a good indication that an individual is viewed as a prominent leader in the school-i.e., the individual that is sought out by others to lend assistance with mathematics.
Figure 1. An Example Sociogram