School Based Partnerships: Using Social Network Analysis to Measure Progress Towards Distributed Leadership


This study is ongoing as part of the external evaluation of the MMP. Data were gathered from eleven (11) and ten (10) schools were examined in Spring 2006 and 2007, respectively (one school participated both years). Data were collected through a social network analysis survey that was administered to all mathematics teachers and other school-based personnel in each subject school. The survey was administered by a trained facilitator usually at a regularly scheduled school staff meeting. Respondents were provided with informed consent forms that promised confidentiality.
The survey was open-ended asked respondents to list the names of individuals with whom they communicated with about mathematics over the past several months. Respondents also indicated, for each individual named, it was indicated whether that individual worked in their school or was outside their school. Respondents were also asked a series of demographic questions that helped classify them for analysis.
The data for each school were processed and analyzed separately. The first step in the analysis was to compile a comprehensive list of all individuals named within a school across all surveys collected - this included both survey respondents as well as other individuals both inside and outside the school who may not have completed the survey. Once this list was developed, each connection was identified - a connection was defined as one individual naming another on their list. At the same time, demographics were compiled for each individual on the list to the extent that they were available. Typically, demographics for in-school individuals were obtained from a school staff list or the survey. Demographics for outside individuals were assigned based on the evaluator's knowledge.
Next, were developed and key individuals, e.g., the MTL, MTS, principal, were identified. Ssocial networks were mapped using UCINET software software. First, a base map was generated where all individuals from the initial comprehensive list were represented. Each individual is represented as a 'node' on the map. Then, the demographics were overlaid on the nodes and the map was shape and color-coded to allow specific individuals and roles to be identified. The following guidelines help in interpreting the final maps.
Distance is important. Closer nodes are more tightly connected than nodes that are further apart.
Color is important. Individuals from the subject school are colored red and those who are not at the school are green. The MTL for each school is colored yellow.
Shape denotes role as follows: Diamond = MTL
Overlapping Triangles = Principal
Up Triangle = Literacy Coach
Down Triangle = MTS
Square = Teacher
Circle = Other role
Third, statistical analysis was conducted to enable deeper understanding of the graphical maps. Two primary statistics were calculated.
Density is a measure of cohesiveness. Density is represented as a proportion where 100% would indicate that all individuals on the map named all other individuals. Because not all individuals named on the survey also completed the survey, achieving 100% density was statistically impossible. Density was calculated for all individuals on the map and for the subset of individuals who worked at the subject school.
In-degree is a measure of 'popularity' which shows how frequently a particular individual was named on a map. In-degree measures are computed for all individuals on the map and are normalized so that results can be compared within and across maps. In-degree was reported for both the MTL and the MTS as indicators of their importance within the school network.
Finally, the results for each school were evaluated and the school was placed on the distributed leadership continuum (see Figure 1). This placement was based on the graphical representation of the network and the associated statistical analysis. Then, these results were related to student achievement results reported for that school. Given that the study has spanned two school years, the achievement result used was the result from the year when data were collected.
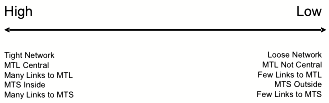
Figure 1. MMP Distributed Leadership Continuum
