School Based Partnerships: Using Social Network Analysis to Measure Progress Towards Distributed Leadership


Table 1 shows the quantitative results from each social network for both study years along with the placement of the each school on the distributed leadership continuum and the student achievement results for that school in that year.
Table 1: Social Network Analysis Results
|
Total Named |
Density |
In Degree |
Distributed Leadership |
Student Achievement |
|||||
|
Year |
School |
n |
Network |
In-School |
MTL |
MTS |
|||
|
2006 |
|||||||||
|
A |
16 |
48 |
3.9% |
7.6% |
11.7 |
2.1 |
2 |
20% |
|
|
B |
23 |
55 |
11.4% |
31.1% |
28.2 |
18.5 |
5 |
68% |
|
|
C |
32 |
61 |
6.3% |
9.2% |
6.7 |
3.8 |
2 |
53% |
|
|
D |
32 |
80 |
4.7% |
7.9% |
11.7 |
6.0 |
3 |
46% |
|
|
E |
19 |
45 |
9.6% |
28.8% |
7.3 |
6.3 |
4 |
59% |
|
|
F |
13 |
31 |
7.2% |
11.7% |
3.3 |
2.5 |
1 |
34% |
|
|
G |
17 |
40 |
6.2% |
9.0% |
17.3 |
3.9 |
1 |
24% |
|
|
H |
17 |
46 |
9.8% |
28.6% |
22.2 |
8.3 |
4 |
45% |
|
|
I |
27 |
91 |
4.0% |
16.2% |
13.2 |
3.0 |
4 |
50% |
|
|
J |
22 |
45 |
5.8% |
28.4% |
13.1 |
1.1 |
3 |
54% |
|
|
K |
14 |
52 |
4.3% |
15.4% |
17.2 |
2.9 |
3 |
27% |
|
|
Average |
21.1 |
54.0 |
6.7% |
17.6% |
13.8 |
5.3 |
2.9 |
44% |
|
|
SD |
6.8 |
17.6 |
2.6% |
9.6% |
7.2 |
4.9 |
1.3 |
15% |
|
|
Median |
19 |
48 |
6.2% |
15.4% |
13.1 |
3.8 |
3.0 |
46% |
|
|
2007 |
|||||||||
|
A |
22 |
43 |
11.7% |
20.1% |
30.6 |
4.4 |
4 |
50% |
|
|
B |
23 |
49 |
5.5% |
7.6% |
20.8 |
0.5 |
3 |
56% |
|
|
C |
36 |
78 |
3.5% |
4.7% |
17.0 |
0.6 |
2 |
45% |
|
|
D |
15 |
47 |
7.1% |
14.8% |
13.5 |
3.5 |
3 |
51% |
|
|
E |
15 |
52 |
5.7% |
18.3% |
18.1 |
2.9 |
3 |
61% |
|
|
F |
22 |
59 |
9.5% |
15.6% |
28.0 |
12.5 |
5 |
71% |
|
|
G |
11 |
42 |
6.1% |
7.5% |
9.5 |
1.2 |
1 |
20% |
|
|
H |
31 |
86 |
4.3% |
10.2% |
11.5 |
0.3 |
4 |
25% |
|
|
I |
28 |
75 |
4.0% |
12.2% |
23.3 |
0.3 |
3 |
21% |
|
|
J |
16 |
40 |
5.7% |
10.6% |
16.0 |
0.6 |
1 |
42% |
|
|
Average |
21.9 |
57.1 |
6.3% |
12.2% |
18.8 |
2.7 |
2.9 |
44% |
|
|
SD |
8.0 |
16.7 |
2.6% |
5.0% |
6.9 |
3.7 |
1.3 |
17% |
|
|
Median |
22 |
51 |
5.7% |
11.4% |
17.6 |
0.9 |
3.0 |
48% |
|
Figure 2 (below) depicts the relationship between a school's position on the distributed leadership continuum and student achievement in the year that school participated in the study.
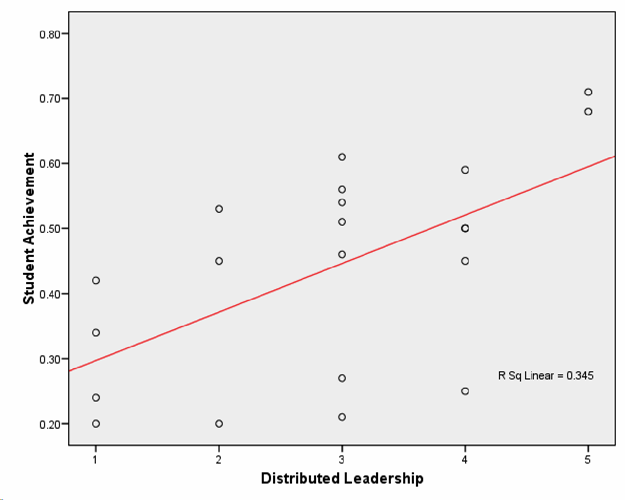
Figure 2. Relationship between Distributed Leadership and Student Achievement
These results support the assertion that schools where distributed leadership is more fully developed are more likely to demonstrate positive student achievement results. Factors that characterize strong distributed leadership include those that this study examined-(1) the level of communication among individuals who work in a school, (2) the position of both the MTL and MTS within a school network, (3) the extent of relationships with individuals outside the school, and (4) the general configuration of the social network map.
While these claims demand further study, the preliminary evidence provided by this work is encouraging.
There is also some emerging evidence to support the claim that schools with better developed distributed leadership exhibit stronger results-but this claim is tenuous at this time and requires further study.
